U.S. Energy
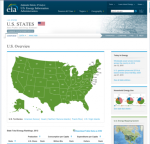
This interactive map of energy production, consumption, and expenditures packs a tremendous amount of information into an easily searchable and up-to-date database. Readers can start with any state in the U.S. to access a profile overview and quick facts. For instance, clicking on Colorado reveals that the Centennial State boasts vast fossil fuel holdings, including the Niobrara Shale, and that it’s crude oil production rose by 146% between 2007 and 2013. The Data tab offers further information about Energy Indicators, Prices, Environment, and other topics, while Analysis will take readers to an informative overview of the state’s petroleum, natural gas, coal, and renewable energy resources.
Archived Scout Publication URL
Scout Publication
Classification
GEM Subject
Date Issued
2012
Language
Date of Scout Publication
January 16th, 2015
Resource URL Clicks
306
Internal
Cumulative Rating
0
Comments