- average daily rates, updated daily at 2pm PST
- more currenices, multiple sources
- archive of historic daily exchange rates
- customizable charts with different output formats
- Different types of trend projections
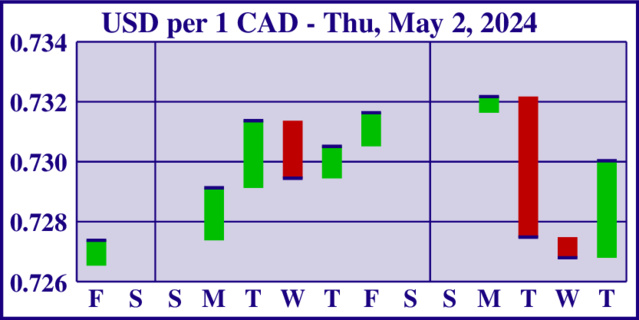
Chart shows CAD-USD rate changes: green bars indicate appreciation and red bars indicate depreciation of the Canadian Dollar day over day; blue lines show daily averages.
THE MOST RECENT CROSS-RATES OF MAJOR CURRENCIES
| USD | EUR | GBP | JP1 | CHF | CAD | AUD | MXN | |
|---|---|---|---|---|---|---|---|---|
| USD | 1.0699 | 1.2491 | 0.6351 | 1.0946 | 0.7316 | 0.6534 | 0.0583 | |
| EUR | 0.9346 | 1.1675 | 0.5935 | 1.0230 | 0.6838 | 0.6107 | 0.0545 | |
| GBP | 0.8006 | 0.8566 | 0.5084 | 0.8763 | 0.5857 | 0.5231 | 0.0467 | |
| JPY | 157.46 | 168.48 | 196.69 | 172.36 | 115.21 | 102.89 | 9.1797 | |
| CHF | 0.9136 | 0.9775 | 1.1412 | 0.5802 | 0.6684 | 0.5970 | 0.0533 | |
| CAD | 1.3668 | 1.4624 | 1.7073 | 0.8680 | 1.4961 | 0.8931 | 0.0797 | |
| AUD | 1.5304 | 1.6375 | 1.9117 | 0.9719 | 1.6752 | 1.1197 | 0.0892 | |
| MXN | 17.154 | 18.353 | 21.427 | 10.894 | 18.776 | 12.550 | 11.209 |
Recent as of Friday, April 26, 2024. Explanations: USD: U.S. Dollar; EUR: European Euro; GBP: British Pound; JPY: Japanese Yen; JP1: 100 Japanese Yen; CHF: Swiss Franc; CAD: Canadian Dollar; AUD: Australian Dollar; MXN: Mexican Peso. Read vertically to find how much each currency buys. The "USD" column shows how many EUR, GBP etc. you get for 1 USD. Read horizontally to find the price of foreign currencies. The "USD" row shows how many USD one has to pay for 1 EUR, 1 GBP etc.
PDF TABLES OF HISTORIC ANNUAL EXCHANGE RATES
OTHER RESOURCES
Legacy Web Pages:
- A brief history of the European Currency Unit (ECU), the predecessor of the Euro.
- The Euro, Europe's New Currency, last updated 7 December 2001.
© 2024 by Werner Antweiler, University
of British Columbia. All rights reserved.
The Pacific Exchange Rate Service is located in Vancouver,
Canada. [
About this service |
FAQ |
Contact me ]