Bloomberg: Here's How America Uses Its Land
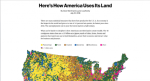
Map aficionados may enjoy this intriguing series of data visualizations published by Bloomberg in late July 2018. Here, readers will find an interactive visual explanation of land use in the continental United States based on different categorizations used by the U.S. Department of Agriculture (USDA). As viewers scroll through the colorful maps, which alternate between showing the approximate locations of the different uses and the total area used by each, they are simultaneously presented with short contextual explanations. For example, the maps illustrate that while about a fifth of the country is devoted to cropland, the area used to grow food that people eat is "much smaller--only about the size of Indiana, Illinois and half of Iowa combined." These maps were created by Dave Merrill and Lauren Leatherby for Bloomberg Graphics using data from sources such as the USDA, the National Land Cover Database, and the U.S. Census Bureau. A brief explanation of their methodology and a list of their sources is included at the end of the presentation.
Archived Scout Publication URL
Scout Publication
Publisher
Classification
GEM Subject
Language
Date of Scout Publication
September 7th, 2018
Resource URL Clicks
290
Comments